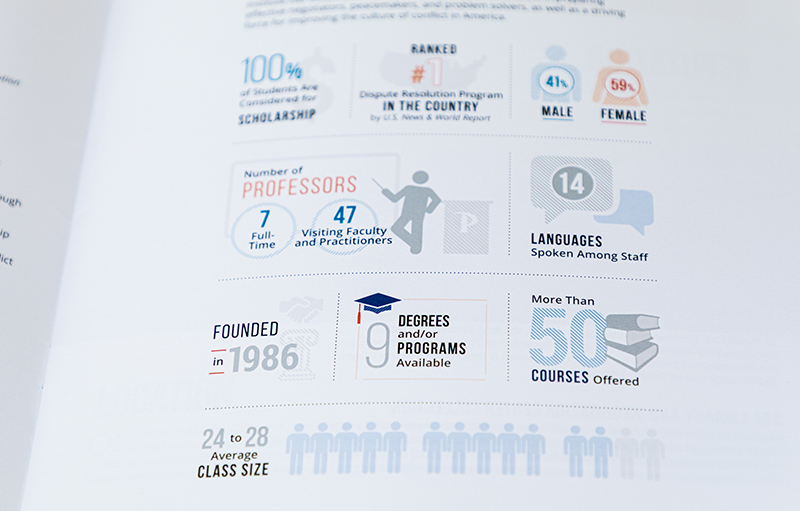
Infographics for the law school.
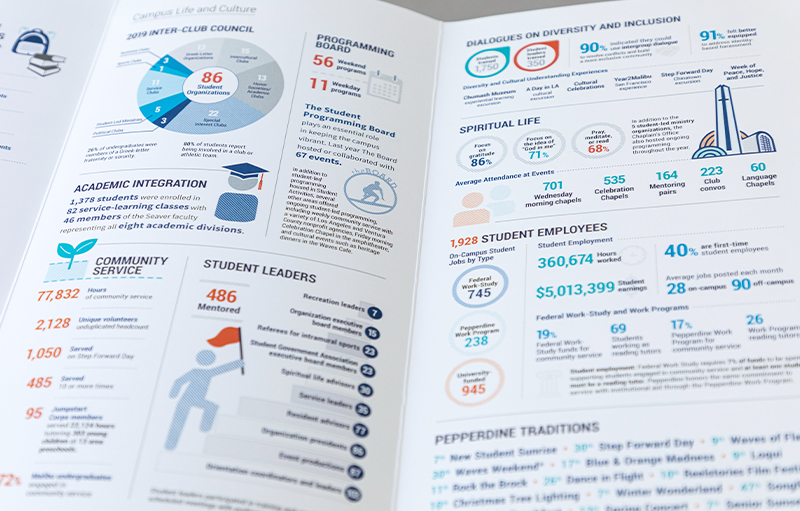
The Student Affairs Annual Report was a fun example of how we used infographics and thoughtful design to transform a dense, traditional report into something engaging that people actually wanted to read—and maybe even remember.
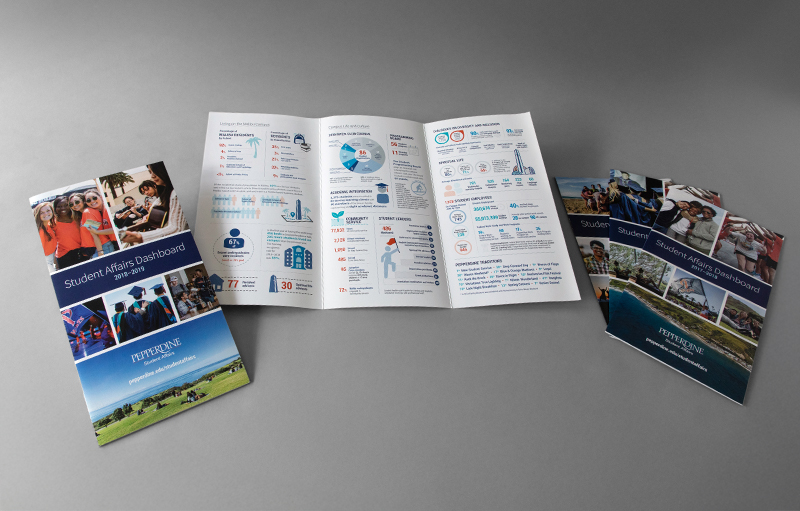
The final product featured 18–20 infographics across five panels. In 2018, I presented Using Infographics to Tell Your Story at the WASC Academic Resource Conference (ARC), using this project as a case study.